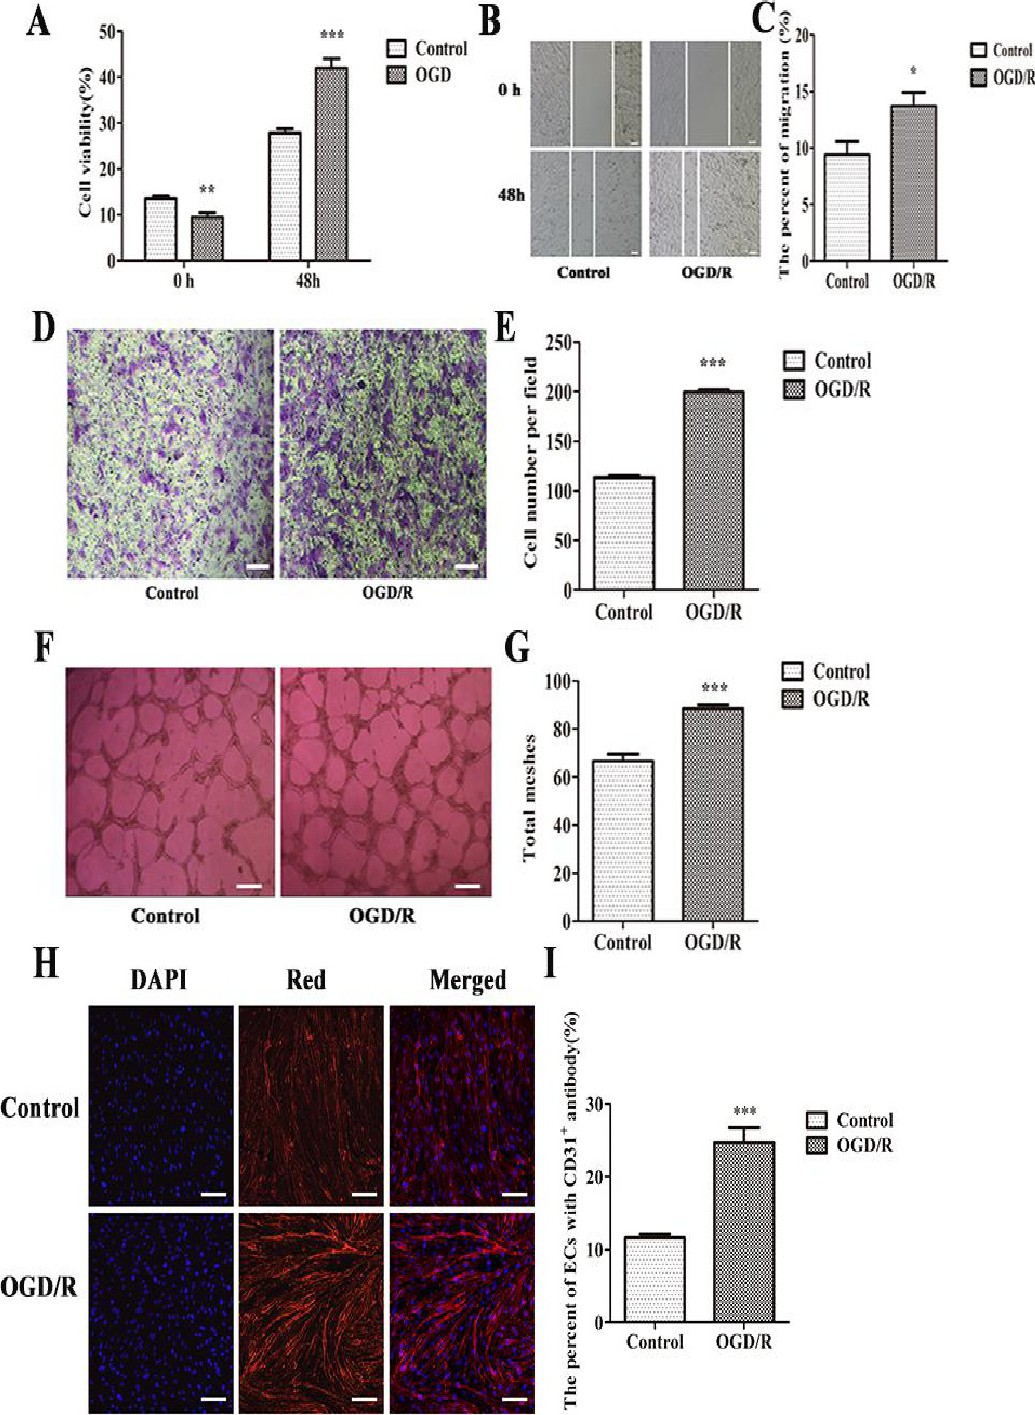
Fig. 2. The survival rate, migration and neovascularization of brain microvascular endothelial cells in the OGD/R group and control group. (A) Cell viability was higher in the control group than in the OGD/R group at 0 h; after 48 h of re-oxygenation, cell viability was higher in the OGD/R group than in the control group (* p <0.05 vs. control). (B) Scratch-wound assay in OGD/R cells compared with control endothelial cells; (C) Statistical analysis of the difference in migration capacity between the OGD/R and control groups (* p <0.05 vs. control). (D) Representative images of transwells in the control group and OGD/R group; (E) Statistical analysis of the number of migrated cells in the two groups. (* p <0.05 vs. control). (F) Tube formation assay in the OGD/R group and control group; (G) Statistical analysis of the number of meshes from two groups (* p <0.05, ** p <0.01, *** p <0.001 vs. control). (H) Representative immunofluorescence staining of the control and OGD/R groups revealed by laser confocal microscopy, scale bar = 50 μm. (I) Statistical analysis comparing angiogenesis between the control and OGD/R groups (* p <0.05, ** p <0.01, *** p <0.001 vs. control). All results are presented as the mean ± SEM.